FeedMap Documentation
Table of contents
Login / Registration
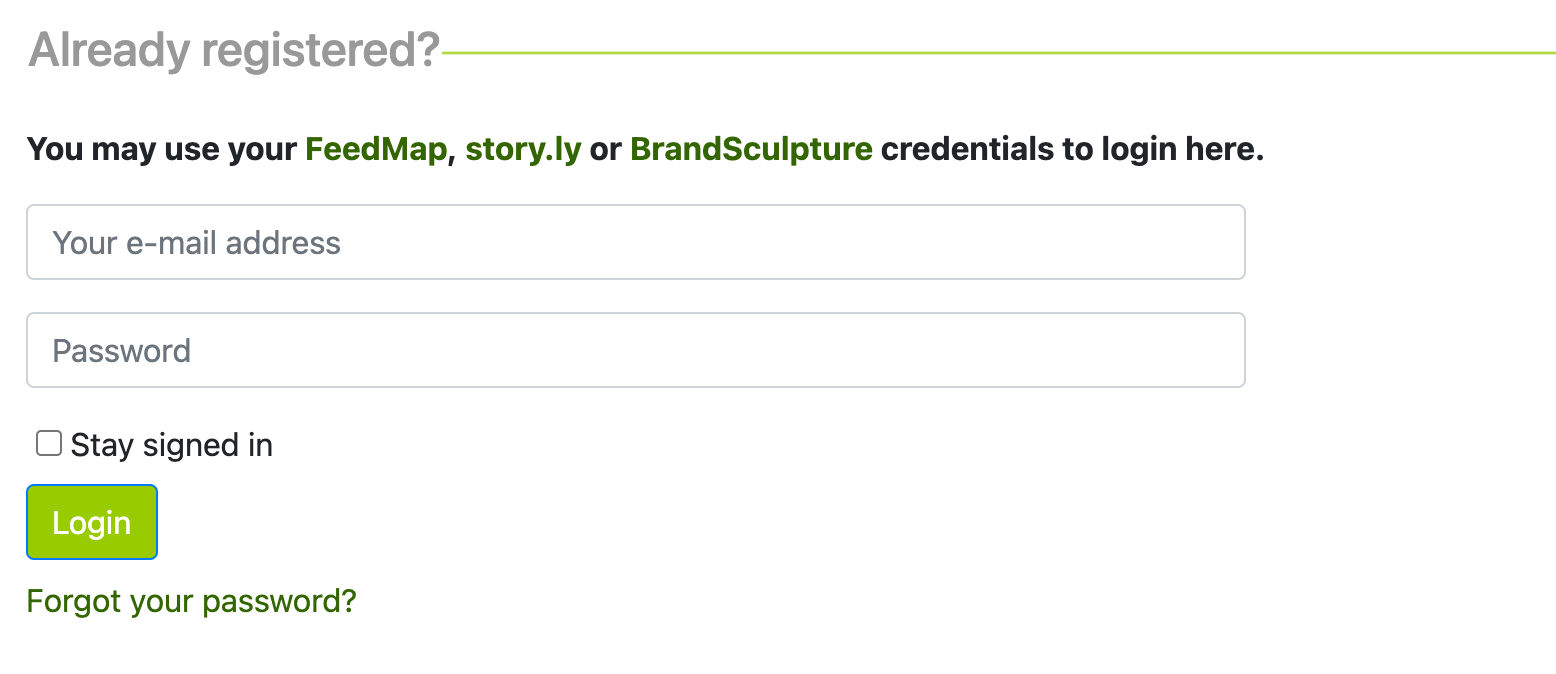
Login
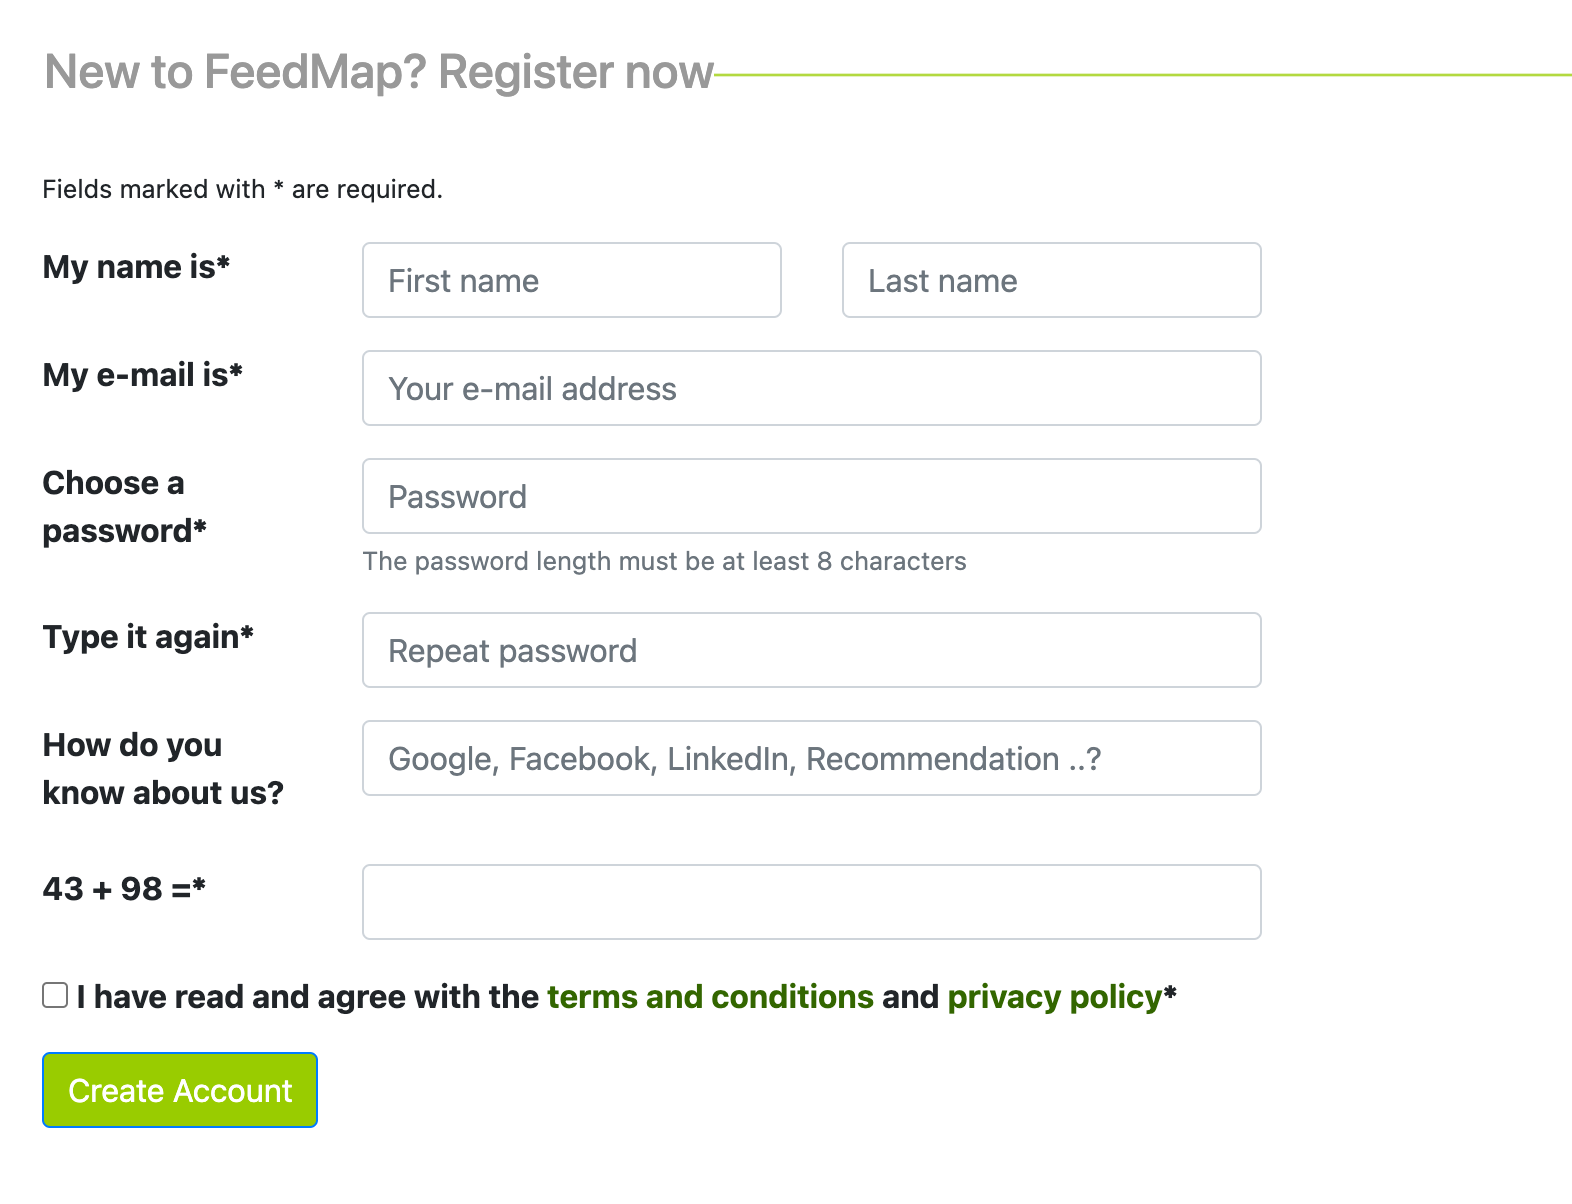
Registration
Fill out the form and confirm it with „create Account“. An email with a confirmation link will be sent to the email address you entered. Visit the link and log in on this page.
Create project
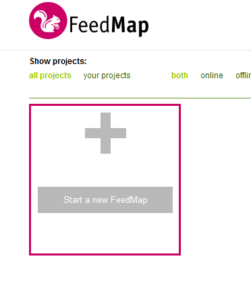
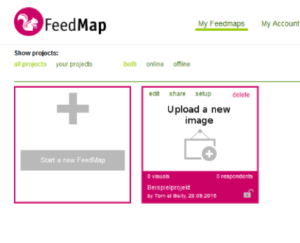
After you have logged in, you will be in the project overview, the Nutshell.
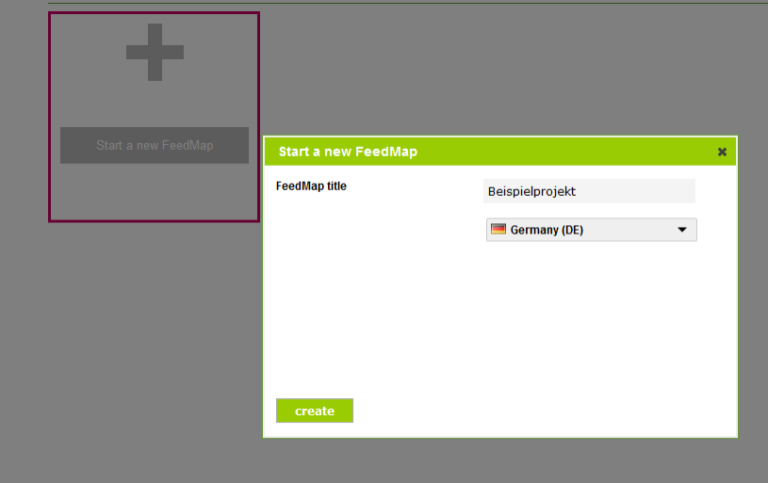
Click on „Start a new FeedMap“ to start the dialogue for creating a new project.
Enter a project name and select your project language, then confirm by clicking on „create“.
The different views
Now that you have created a project, you have several options to continue.
If you hover over your created project, four options will appear at the top. „edit„, „share„, „setup“ and „delete“.
„edit“ lets you edit the project name and language.
„share“ opens the share view
„setup“ takes you to the setup view.
„delete“ deletes the project, this cannot be undone.
To be able to define basic settings, first go to the setup menu..
Setup
A new project
The structure of the Setup section is based on the navigation in Setup, but if this is a new project, you should follow the sections in the order of uploading image(s).
Project setup
At every point in the setup there is a help bar at the top right.
The „question mark“ starts a guided tour with explanation of the current view.
Image upload
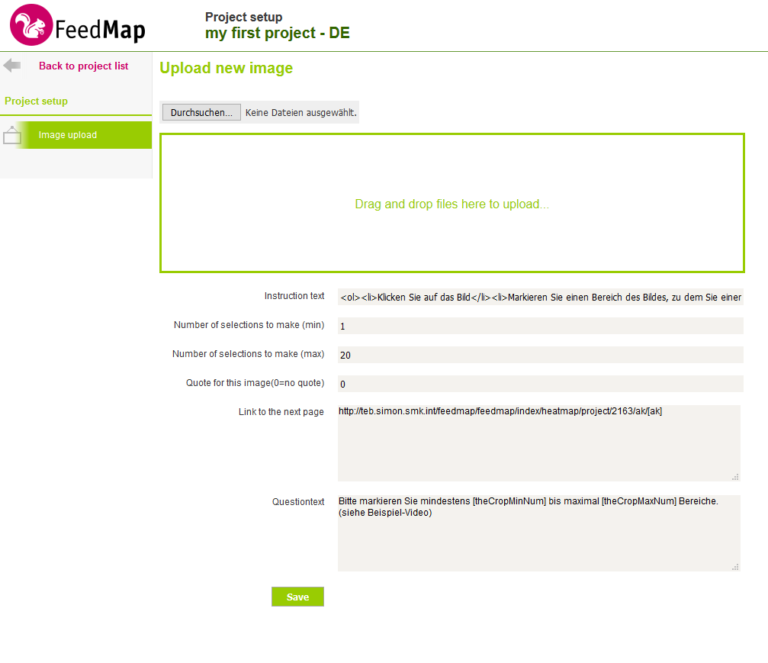
The first step is always to upload a visual. Therefore, when you visit a fresh project, you will be taken directly to the view to upload a visual.
You have the choice of pushing one or more images directly from your file directory into the green area or uploading them from your computer via the selection button.
In the boxes below you can select options for your images. If in doubt, you can keep all the default values.
The instruction textwill be displayed to your participants, it should contain explanatory text. You can insert free text there using HTML commands.
In the fields Number of selections to make(min) and Number of selections to make(max) enter the minimum and maximum number of areas your participant must/may mark.
Quote for this image(0=no quote) is the quota for this image. If you want only a limited number of participants to rate your image, specify that number here.
Link to the next page contains the link to which your participants should be redirected after they have rated the image. The default value is the Report view.
The Questiontext is displayed above the image to be rated. You can use here the placeholders [theCropMinNum]and [theCropMaxNum] that you defined above.
Confirm everything by clicking on „Save“ to upload your images.
Project settings
In the project settings you set options that apply to all images in this project.
Basic settings
The basic settings contain texts that are displayed to your participants in the Respondent view. You can edit all the default values here if you do not like the wording.
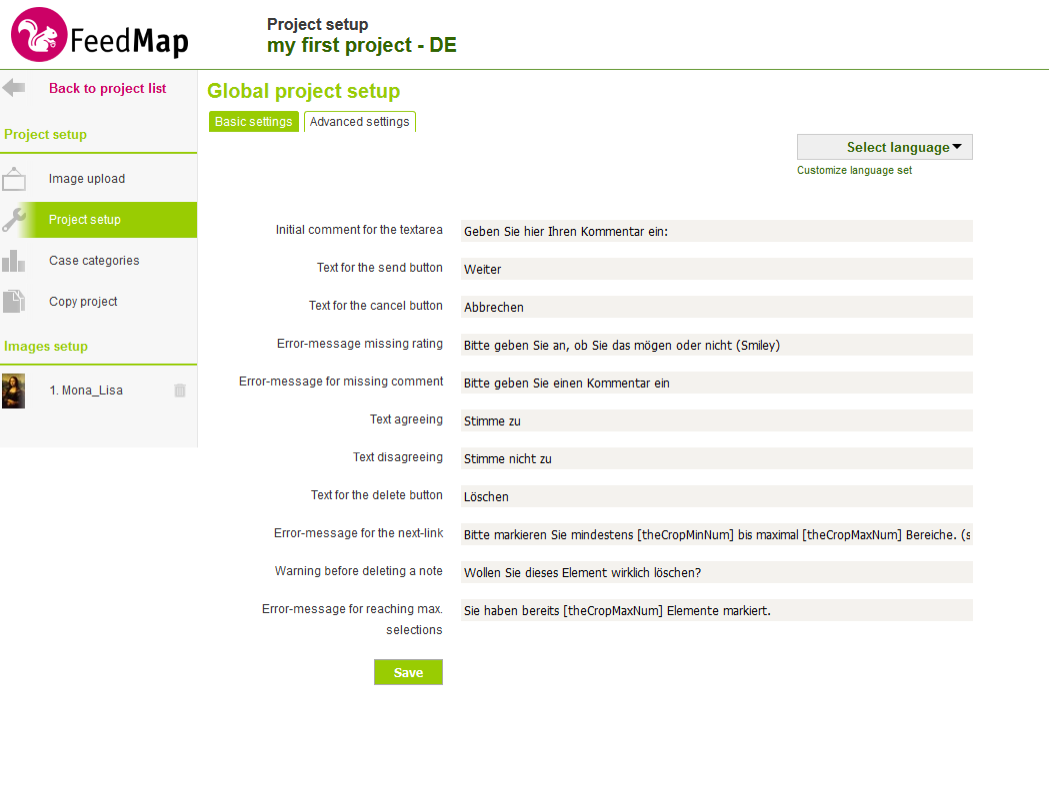
Advanced settings
The advanced settings contain mainly functional settings, which we will now go through:
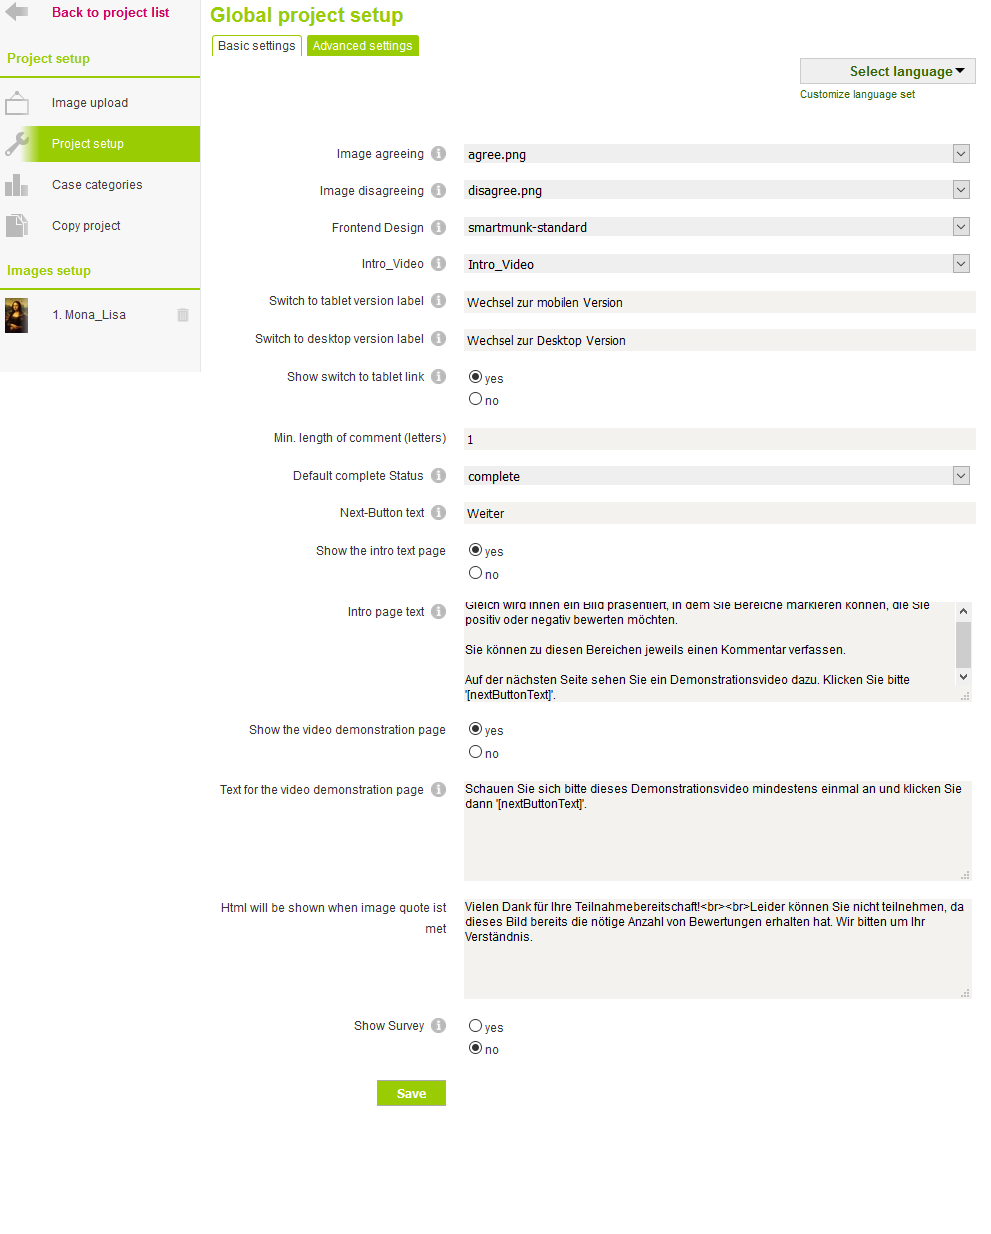
Image agreeing selects the agreeing image and Image disagreeing selects the disagreeing image in the participant view. The default images are ![]() . In the drop-down menu you can select the default image or choose the sub-item Upload a new icon to upload your own icons. (See also changing image agreeing/disagreeing).
. In the drop-down menu you can select the default image or choose the sub-item Upload a new icon to upload your own icons. (See also changing image agreeing/disagreeing).
Under Frontend Designyou can choose one of our standard designs. If you would like a custom design, get in touch with us using the „Chat“ or „Contact“ function.
Intro Video indicates the sample video that will be shown to your participants. You have the option of selecting our video from the drop-down menu or uploading your own video via the Upload a new video item. (See also Changing the demo video.
Switch to tablet version label and Switch to desktop version label specify the texts that, if Show switch to tablet link is set to yes, will be displayed in the participant view to switch between the mobile and desktop views.
Use Min. length of comment(letters) to specify the minimum length of the comment your participants write.
Default complete Status sets the internal status your participants receive after they have rated images. In all evaluation views, only participants marked as complete are taken into account, which is why you should keep the default value.
In the Next button text is the caption for the Next button in the participant view.
If Show the intro text page is set to yes , the intro page text is shown.
When Show the video demonstration page is set to yes , the video selected above will be displayed to the participants.
The text in Text for the video demonstration page is displayed above the demo video.
The HTML text in Html will be shown when image quote is met will be shown to the participant when a quote has been set in the image-settings and this has been met.
If the show survey value is set, when the participant arrives at the participant view without case-variables, the participant will be shown a short survey of all the options defined in the case variables.
Change from image agreeing/disagreeing.
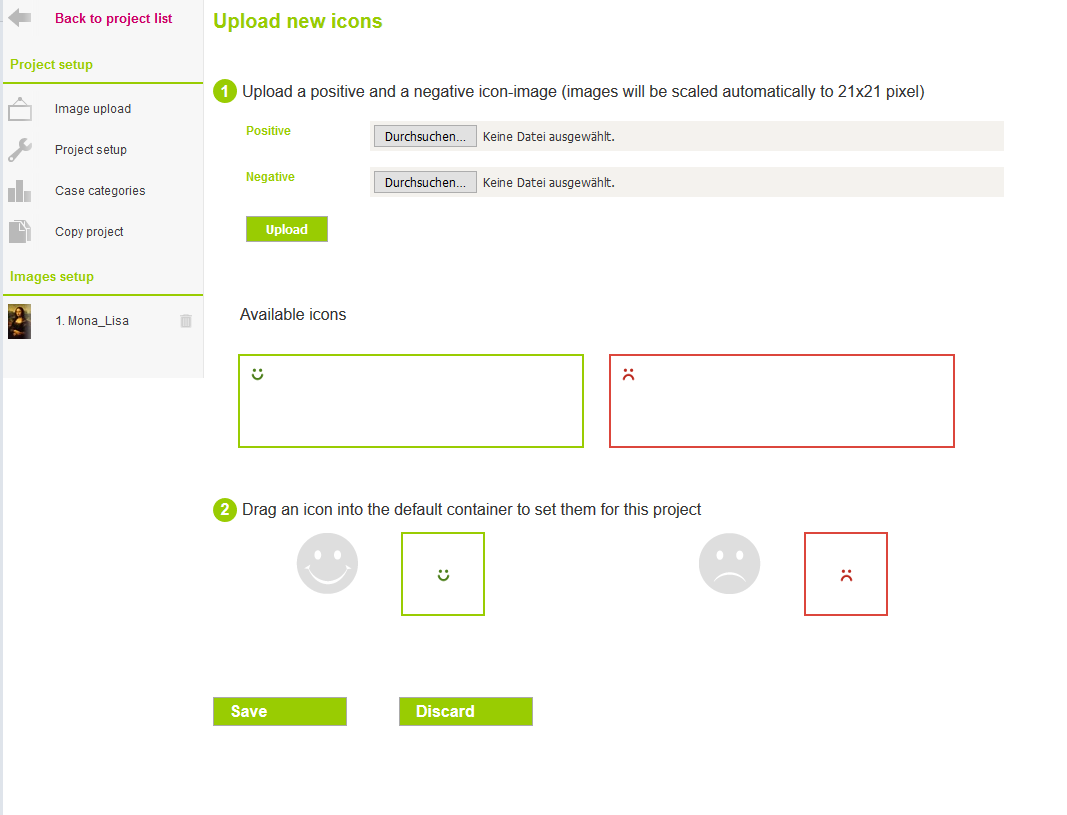
After clicking Upload a new icon in the drop-down menu of the Image agreeing or Image disagreeing option in the advanced settings of the project settings you are on the page, to change the default icons.
In the upload dialogue, under Positive select an icon to show for the affirmative selection of your participants, and under Negative that for the negative.
After that, click the „Upload“ button.
Your selected icons will automatically be scaled to 21×21 pixels.
After you have pressed upload, your selected positive icons will be displayed in the left green box and the negative ones in the red right box.
To change your current icon, drag it into the appropriate box below .
To apply, select the „Save“ button, to undo your changes, click „Discard“.
Changing the demo video
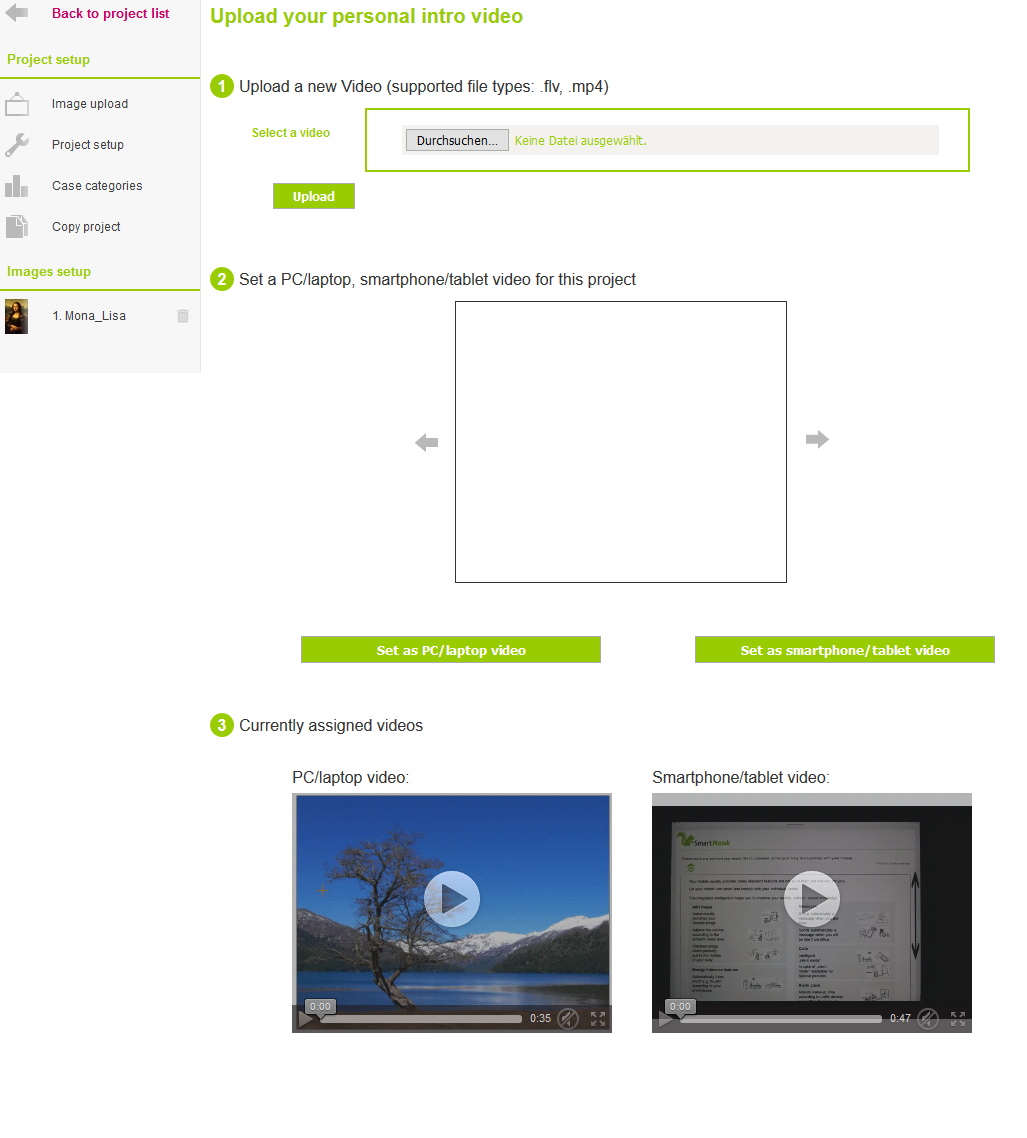
After clicking Upload a new video in the dropdown menu of the Intro Video option in the advanced settings of the Project Settings, you are on the page to customise the intro video.
Select a video from your hard drive under ![]() and press „Upload“.
and press „Upload“.
After that, the video will be displayed under ![]() in the carousel. Click on the arrow images there to rotate through all your uploaded videos.
in the carousel. Click on the arrow images there to rotate through all your uploaded videos.
If you want to select one of the videos as a PC or as a smartphone/tablet video, click on the corresponding button.
Under ![]() are your currently set videos.
are your currently set videos.
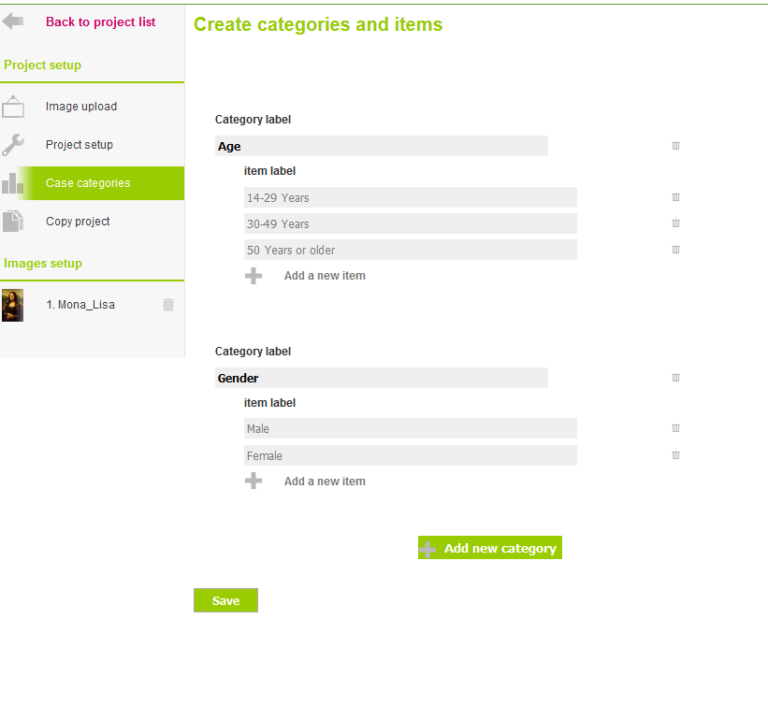
Case categories
Case variables are used to divide your participants into categories. So that after everyone has rated your picture, you can compare different groups.
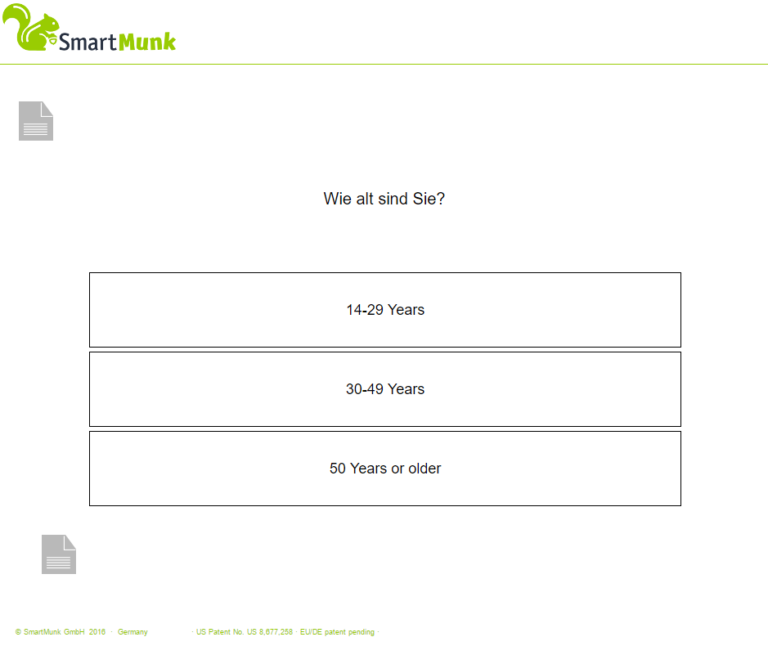
By default, you already have the category label Age with the item labels 14-29 Years, 30-49 Years, 50 Years or older and Gender with the item labels Male and Female.
You can create as many new categories as you like with the button „Add new category“
You either manually assign expressions to your participants via the share links (see share menu) or show your participants a short survey when they visit your FeedMap (see Show Survey under Project Settings => advanced settings). If the option for Show Survey is set to yes you will also see text fields under the categories in the case variable view.
In these text fields you can enter questions about the categories, which will then be displayed to your participants in the participant view. If you leave these fields blank, even though you have set Show Survey to yes, only the category will be displayed as the question text. For example, a reasonable text with the case variable shown would be „How old are you?“
To apply your changes, press the „Save“ button at the bottom of the page.
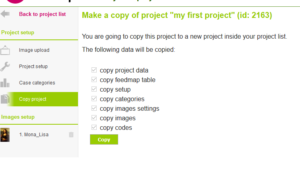
Copy project
This option is for copying your current project into a new one.
If you want to repeat a project of a similar nature and only the visuals change, you can use this function.
Select the data you want to copy into your new project in the checkboxes and then press „Copy“.
Your newly created project will then be found in the Nutshell for further editing.
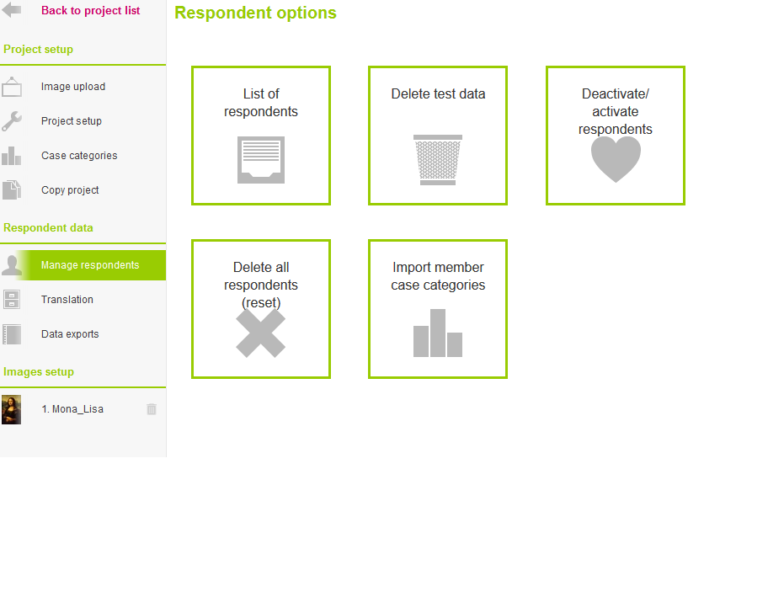
Respondent data
Once participants have rated their images, this view will appear in the setup.
You have the option here to manage, translate or export your participant data.
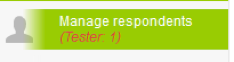
Manage respondents
In this menu item you have the options to display a list of all participants, delete your test participants, activate/deactivate specific participants, delete all data about your participants and import case variables afterwards.
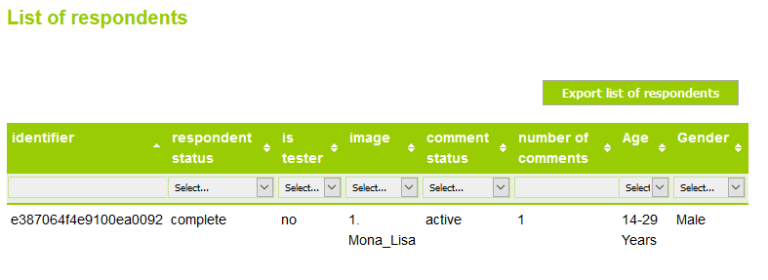
List of respondents
This will show you a list of all participants who have rated your picture.
In this table you will find under identifier a unique identification of the participant. Respondent status indicates the status of the participant, is a tester whether he is a tester, image which image he has rated, comment status whether his comments are displayed in the report, number of comments how many comments he has written and subsequently all the characteristics of the categories defined in the case variables. If these have been passed.
By clicking on „Export list of respondents“, an Excel list of this information can be exported.
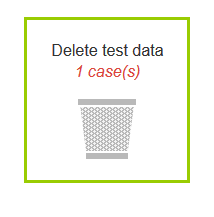
Delete test data
If you have test records, you can see in the menu in red lettering under the item „Manage respondents“.
This is also visible on the tile „Delete test data“.
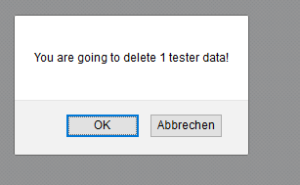
If you want to delete the test data, click on the tile. A dialogue box will then open. If you confirm this with „OK“, all your test data will be deleted.
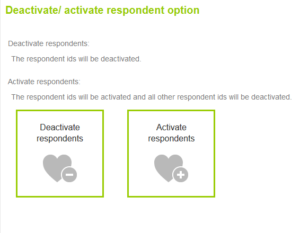
Deactivate/ activate respondents
Select the „Deactivate respondents“ tile to switch participants to inactive.
Select the „Activate respondents“ tile to switch respondents to active.
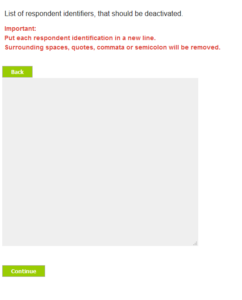
Deactivate respondents
In this field, enter line by line the unique identification of the participants you want to deactivate. You can get the identifications from the list of your participants.
Confirm your selection by clicking on „Continue“.
If you have entered valid identifications, you will be asked to confirm your selection again. Do this by clicking on „Save“.
Now the participants entered are set to inactive and are no longer included in the evaluations.

Activate respondents
Enabling participants is an exclusive function. This means that all participants that you do not enter in the field will automatically be set to inactive!
In this field, enter line by line the unique identifications of the participants you want to deactivate. You can get the identifications from the list of your participants.
Confirm your selection by clicking on „Continue“.
If you have entered valid identifications, you will be asked to confirm your selection again. Do this by clicking on „Save“.
Now the participants entered are set to active and all others to inactive.
Delete all respondents
If you want to delete all your respondent data, select the tile „Delete all respondents“. You will then be asked twice to confirm your intention, as this operation is irreversible.
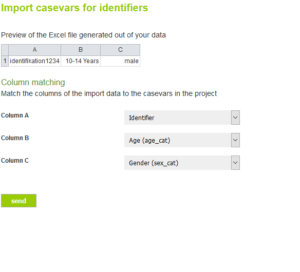
Import case variables
In this view you have the possibility to play case variables to your participants.
To do this, enter the identification and value of the case variable, separated by tabs, line by line.
e.g.
identification1234 10-14 Years male
identification1235 50 Years or older female
Confirm your entry with „send“.
You will then be taken to a page where you can assign your columns to the appropriate categories using dropdown menus. Once you have done this, confirm this again by clicking on „send“.
Translation
You can also translate and re-upload the comments that your participants have provided.
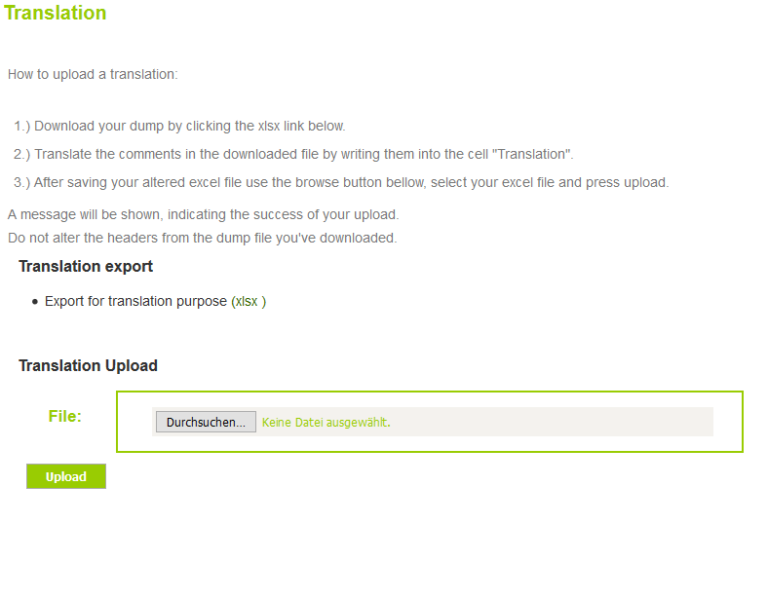
Download
Click on „xlsx“ in the item Export for translation purpose(xlsx), to download the Excel file with the texts.
Upload
In the downloaded Excel file you can enter the text translated from the Comment column. Save the edited file and upload it in the Translation Upload item.
Confirm with „Upload“. Afterwards, the texts you have translated can also be viewed in the report.

Data exports
Here you will find various data exports. If available, you can choose whether you want to download the exports as „xlsx“ or as „csv“ files.
Export report contains every code and text associated with each image in your project.
The Easy readable export contains, line by line, every combination of comment and code.
All comments and all codes per line are contained in the Export for further processing(e.g. SPSS).
All comments per participant per row can be found in the User comments per row export.
For each of your images, all comments per participant sorted by rating and code can be found in the Concept based exports.
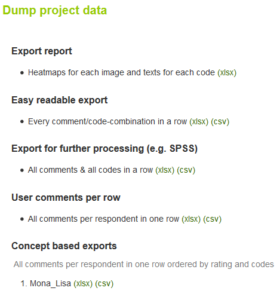
Image setup
The picture settings always refer only to the currently selected picture.
View image
In this tab you will see your current image, as well as the option to replace it with another by clicking on „Replace this image by a new one“.
Basic settings
Here are rudimentary settings for your image.
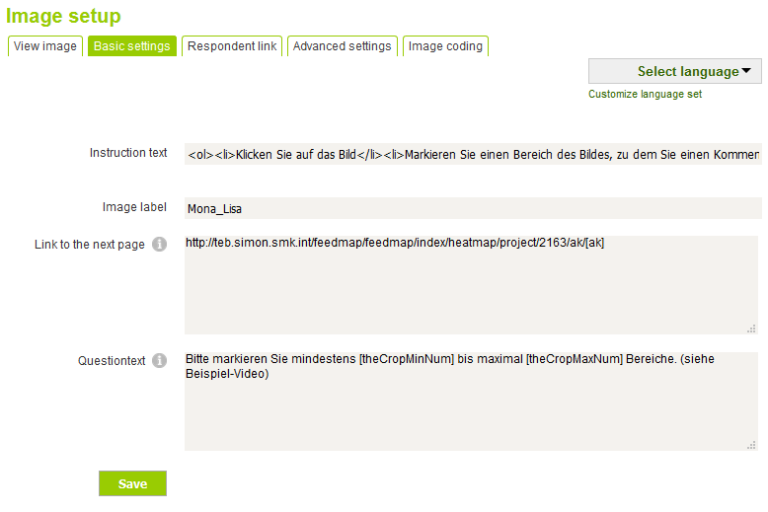
The instruction textwill be displayed to your participants, it should contain explanatory text. You can insert free text there with HTML commands.
The image label is the internal name of your image, it is also shown on the left side of the menu.
Link to he next page contains the link you want your participants to be redirected to after you have rated the image. The default value is the Report view.
The Questiontext is displayed above the image to be rated, you can use here the placeholders [theCropMinNum]and [theCropMaxNum] which you define under the advanced settings.
Confirm everything by clicking on „Save“ to save the changes.
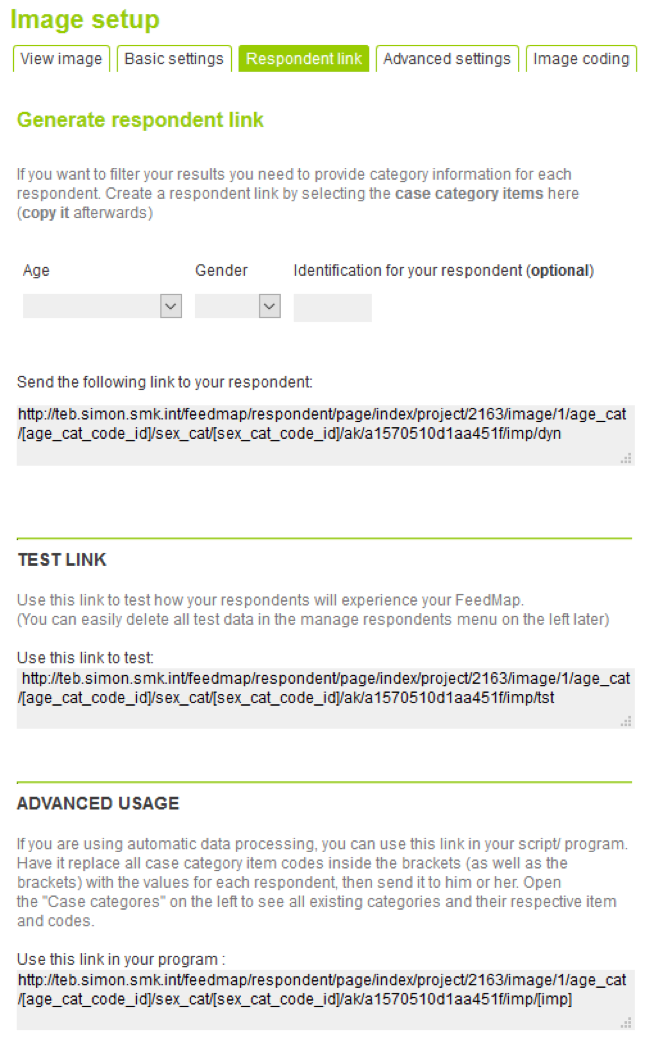
Respondent link
This view is used to generate the various links you need to invite participants to rate your image.
If you have selected the Survey option in the project settings, you can also send your participant the default link from the Share menu.
If you know who you want to send a link to and you want to pre-populate their case variables, select the appropriate case variables from the drop-down menus. The link below will adjust accordingly.
Use the test link to test your FeedMap, all participants who used this link will show up in your participant management as testers.
If you want to use a survey engine, you need the link from Advanced Usage. There you will find the different case variables in square brackets. You then need to have these replaced in the environment of your survey engine you are using.
Advanced settings
The Sortnumber of the imageindicates the sort order in your menu structure.
In the fields Number of selections to make(min) and Number of selections to make(max) enter the minimum and maximum number of areas your participant must/may mark.
Quote for this image(0=no quote) is the quota for this image. If you want only a limited number of participants to rate your image, specify that number here.
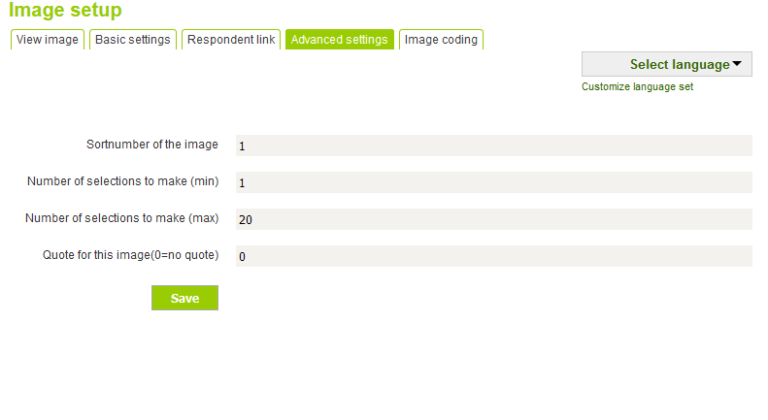
Image coding
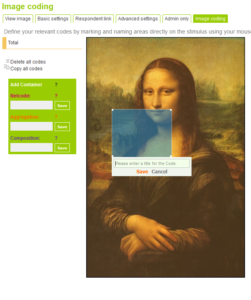
What?
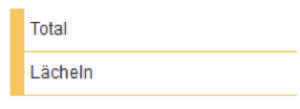
Coding in this case refers to assigning so-called codes to different areas of an image. Each image is automatically given an initial code, this is called „Total“ and is located on the entire image.
Why?
Vercoding is used to make it easier to assign markers from participants to specific areas of your image. They are also shown in the analysis view.
So you can, for example, put all the occurring texts on an image into a code and then see in the analysis at a glance how they have affected the participants.
How?
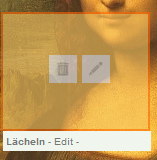
Click in your picture and drag a box. A window will pop up where you give your code a name. Then click on „Save“ to create the code. A created code can also be resized and repositioned after it has been created by hovering over your created code with the mouse and clicking „Edit“.
Codes you have created can be found at the top left, you can also rearrange them by dragging and dropping.
If you want to combine several codes into one, there are three different options available.
Thenetcode is a content container. All codes that you subordinate to this code are independent and are also considered individually in the analysis.
The aggregation combines several codes into one code. Markers must cover at least one of the child codes by 60% to be assigned to the container in the analysis.
The composition combines several codes into one, this behaves like a code. To be hit, a mark must hit at least 60% of all codes.
Share
In the partial view you have several options to share your FeedMap.
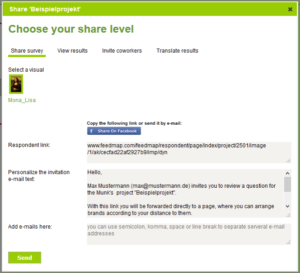
Share survey
Under the Share survey tab, you can specify a list of email addresses, which will then be emailed the participation link. The link will then direct participants to the Respondent view.
If you have multiple images in your project, you can Select a visual to select the one you want to share.
The link in Respondent link automatically adjusts to the selected image. In Personalise the invitation e-mail text there is a default invitation text that you can customise according to your wishes.
In the Add e-mails here field, enter e-mail addresses. Separate these addresses by either semicolon (;), comma(,), , space ( ) or newline.
Click „Send“ when you have entered all the addresses to which you want to send the FeedMap for evaluation.
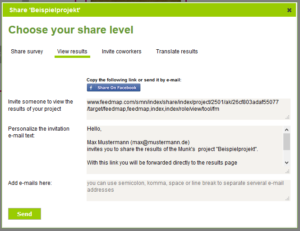
View results
Here you can send people a link to your report.
The link can remain unchanged. In Personalise the invitation e-mail text there is a default invitation text that you can customise to your liking.
In the Add e-mails here field, enter e-mail addresses. Separate these addresses by either semicolon (;), comma(,), , space ( ) or newline.
Click „Send“ when you have entered all the addresses to which you want to send your results.
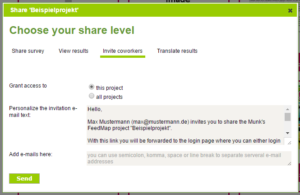
Invite coworkers
Use this tab to share your FeedMap with colleagues.
Under Grant access to, select this project if you want to share only the selected project, or all projects if you want to share all your projects.
Under Personalise the invitation e-mail text there is a ready-made text that you can customise to your liking.
In the Add e-mails here field, enter e-mail addresses. Separate these addresses by either semicolon (;), comma(,), space ( ) or newline.
Click „Send“ when you have entered all the addresses. An email will now be sent to the addresses entered, if they click on the link contained in the email they will be taken to the login page where they can either log in with their existing details (see Login), or create a new account (see Register). After that, they will have access to the projects you have shared.
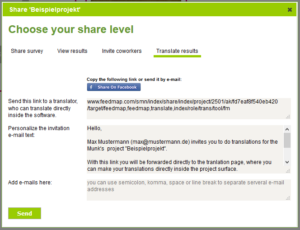
Translate results
You can give this link to your translator if you wish. He will be directed to the translation view in the report. You can also upload your translations via an Excel file. (See Translations in Setup).
The link can remain unchanged. In Personalise the invitation e-mail text there is a default invitation text that you can customise to your liking.
In the Add e-mails here field, enter e-mail addresses. Separate these addresses by either semicolon (;), comma(,), space ( ) or newline.
Click „Send“ when you have entered all the addresses to which you want to send your results.
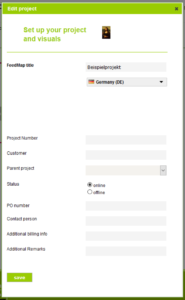
Edit
Here you can change the basic settings of the project you have created.
At FeedMap title you can change your project name. In the dropdown menu below, you can change the project language you have previously set.
Under Parent project, select a parent project for this project, if desired.
If you change Status from online to offline your project is no longer accessible online. You should only do this if you are sure that you no longer want to use this project.
Project Number, Customer, PO number, Contact persion, Additional billing info and Additional Remarks are internal fields that you can fill in, or leave blank.
Click on „save“ to save your changes.
Participant view
The respondent or participant view is displayed to your respondents. It is used to rate your images. You can define which parts should be displayed to your participants in the settings. (see advanced project settings).
Survey
If you have sent your participant a standard link and you have activated the survey in the project settings (see show survey), the first thing he sees is a small survey. There he has to click to select all the case variables that are set. (see case-variables)
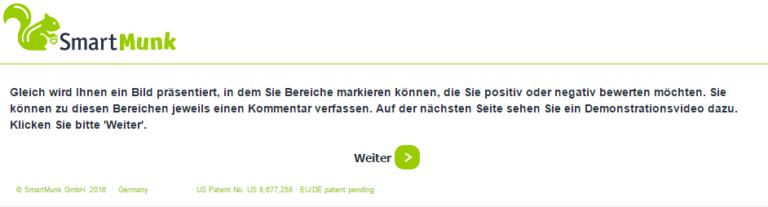
Introductiontext
Your participant will then be shown a welcome text. This text is set in the project settings. (see introduction text)
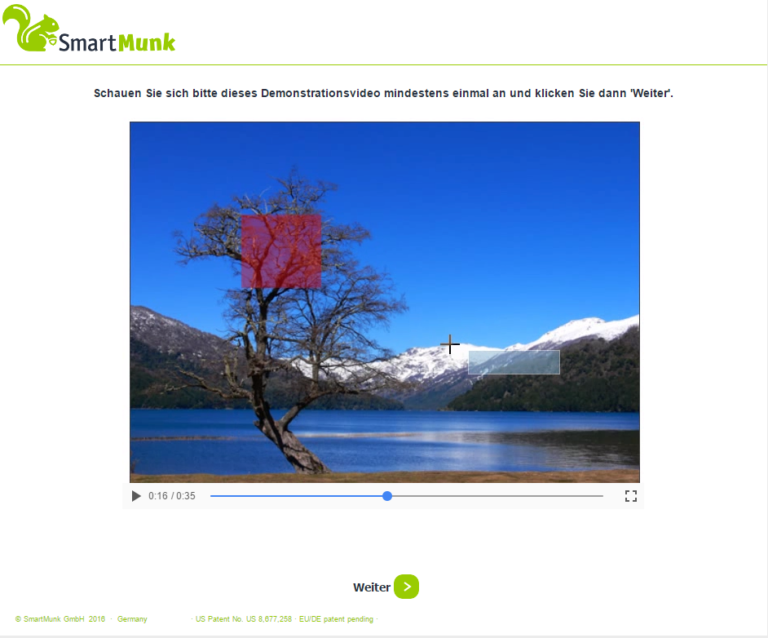
Demovideo
When turned on, a video is displayed to your participant. It shows the use of FeedMap and adapts when the participant arrives with a mobile device. You can replace the video with one you have created. (See Swapping the demo video).
FeedMap
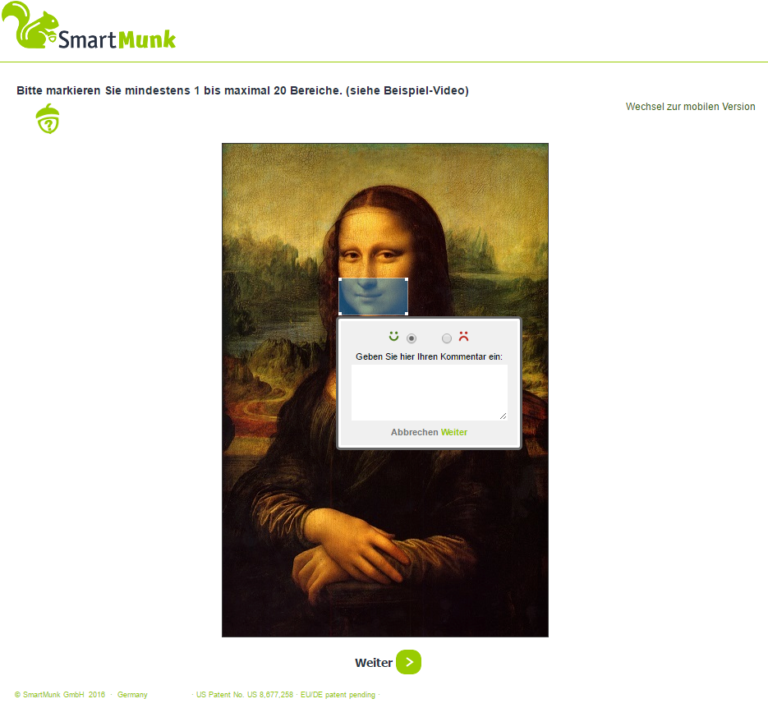
On the FeedMap, participants can now mark the areas they like or dislike and make a comment on them.
The above instruction can be customised in the image settings. (See Basic settings)
The icons displayed can be replaced with your own. (See Changing icons)